AgriPhys: From Satellite Images to a Physical Field Model
AgriPhys explores how a physical model can help farmers interpret variation within thier agricultural field. We combine terrain with satellite-derived vegetation patterns and fabricate a color-coded, 3D-printed field model. This example follows one field across six growing seasons, from annual NDVI imagery to a five-zone map and a printable terrain model. The zones show relative patterns within this field and they are prompts for investigation, not recommendations for treatment or proof of soil quality.
Annual NDVI images
These PlanetScope NDVI images show vegetation at one selected date in each year. We used the same color scale, so colors can be compared across the six images. Many factors including weather, crop type, and field management can also affect NDVI.

| 2020 · August 5 | 2021 · July 23 |
|---|---|
 |
 |
| 2022 · August 13 | 2023 · June 24 |
|---|---|
 |
 |
| 2024 · July 8 | 2025 · June 30 |
|---|---|
 |
 |
From six years to field zones
The multi-year average below summarizes the NDVI data. The zone map groups spatial patterns into five relative classes, from red (lower relative performance) to dark green (higher relative performance). Areas outside the mapped field are left blank.

Multi-year average NDVI, shown with the same continuous scale as the annual images.
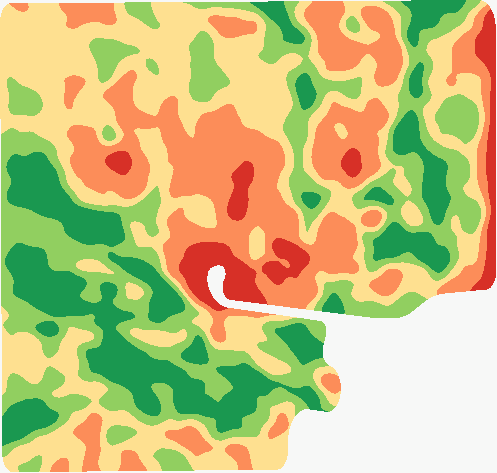
Five relative field zones: 1 red: Low performing · 2 orange · 3 yellow · 4 light green · 5 dark green: High performing.
Physical field model
The 3D-printed model brings the terrain and the five colored zones together in a tangible form. The downloadable file contains the full mesh and its print colors.
Download the AgriPhys 3MF model (approximately 3 MB). Open it in a compatible 3D-printing or 3MF viewing application to inspect or prepare it for printing.

Faramarz F. Samavati
Professor
My research interests include Computer Graphics, Geometric Modeling, Visualization, and Digital Earth.