Interactive Visualization of Energy System
Abstract
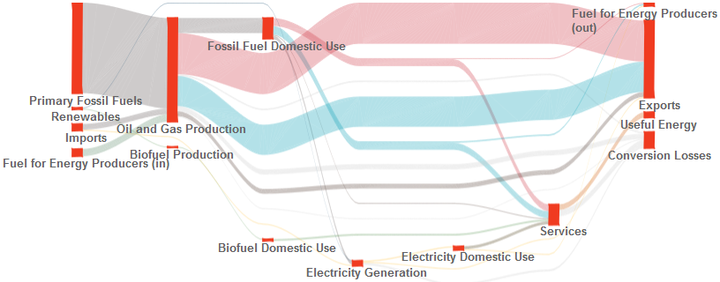
Energy systems are under pressure to transform in order to address concerns about climate change. The modeling and visualization of energy systems can play an important role in communicating the costs, benefits and tradeoffs of energy systems choices. We introduce a visualization tool that provides an interface for exploring time-varying, multiattribute and spatial properties of a particular energy system. The tool integrates several visualization techniques to facilitate exploration of a particular energy system. These techniques include flow diagram representation to show energy flow, 3D interaction with flow diagrams for expanding viewable data attributes such as emissions and an interactive map integrated with flow diagrams for simultaneous exploration of spatial and abstract information. We also perform level of detail exploration on flow diagrams and use smooth animation across the visualizations to represent time-varying data. As a means of preliminary evaluation, we have included feedback on this tool from our energy system collaborators.