Artistic Inspired Data Visualization Design Process
Abstract
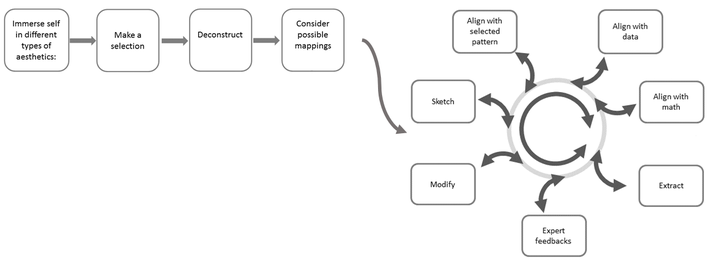
In this paper we describe our design process for creating artistically inspired data visualizations. We consider graphs as an example of interest for data visualization, and present several novel graph layouts developed using this design process. Through our exploration, we have become increasingly convinced that any intriguing pattern, mesmerizing ornament or exciting art piece may be a source of inspiration for new graph layouts. However creating a mapping between a graph and the selected pattern is hard and challenging, and can be helped by using a methodical and iterative design process.
Katayoon Etemad
Alumni Postdoc and Research Associate
September 2016 - 2022
Katayoon is a Postdoctoral Scholar interested in information visualization, human computer interactions, and aesthetic visualizations.