Perspective Charts
Abstract
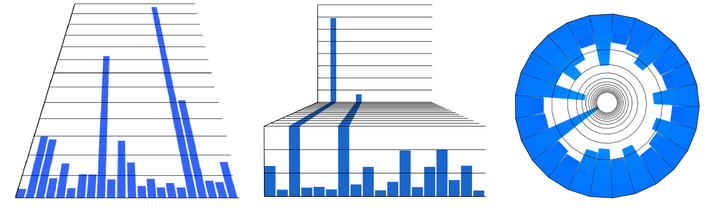
We introduce three novel data visualizations, called perspective charts, based on the concept of size constancy in linear perspective projection. Bar charts are a popular and commonly used tool for the interpretation of datasets, however, representing datasets with multi-scale variation is challenging in a bar chart due to limitations in viewing space. Each of our designs focuses on the static representation of datasets with large ranges with respect to important variations in the data. Through a user study, we measure the effectiveness of our designs for representing these datasets in comparison to traditional methods, such as a standard bar chart or a broken-axis bar chart, and state-of-the-art methods, such as a scale-stack bar chart. The evaluation reveals that our designs allow pieces of data to be visually compared at a level of accuracy similar to traditional visualizations. Our designs demonstrate advantages when compared to state-of-the-art visualizations designed to represent datasets with large outliers.
Mia MacTavish
Alumni M.Sc. Student
January 2018 - September 2021
Mia was an MSc student interested in Digital Earth, non-photorealistic rendering and data visualization.