Perspective Charts in a Multi-Foci Globe-Based Visualization of COVID-19 Data
Abstract
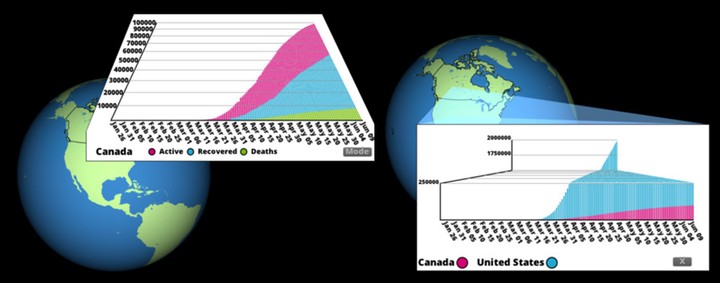
The use of perspective projection in data visualization has been shown to potentially aid with the perception of small values in datasets with important variations at multiple scales. We integrate perspective charts, which use perspective projection in their designs, into a geospatial visualization application for global COVID-19 data. We perform an evaluation through Amazon Mechanical Turk to evaluate the readability of these visualizations compared to traditional methods, when tools such as interactive techniques are used. Results of our evaluation show that participants more accurately retrieved small values from perspective chart visualizations than traditional bar charts on the globe. The use of perspective projection in an interactive system allows for users to read data with important variations at multiple scales without affecting the overall perception of scale in datasets.
Mia MacTavish
Alumni M.Sc. Student
January 2018 - September 2021
Mia was an MSc student interested in Digital Earth, non-photorealistic rendering and data visualization.