Distance Transform-Based Spatiotemporal Model for Approximating Missing NDVI from Satellite Data
Abstract
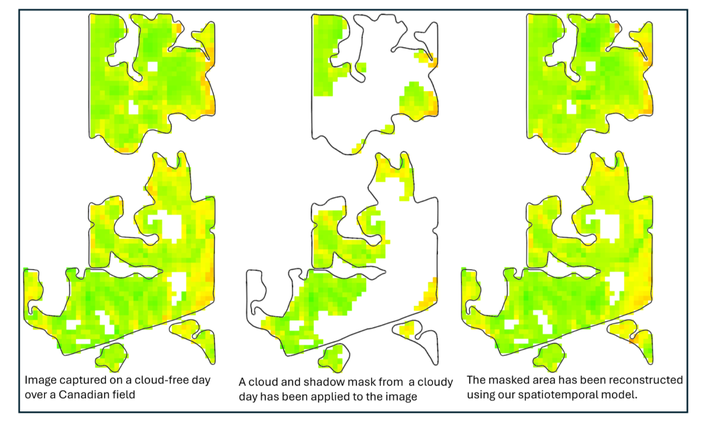
One widely used method for analyzing vegetation growth from satellite imagery is the Normalized Difference Vegetation Index (NDVI), a key metric for assessing vegetation dynamics. NDVI varies not only spatially but also temporally, which is essential for analyzing vegetation health and growth patterns over time. High-resolution, cloud-free satellite images, particularly from publicly available sources like Sentinel, are ideal for this analysis. However, such images are not always available due to cloud and shadow contamination. To address this limitation, we propose a model that integrates both the temporal and spatial aspects of the data to approximate the missing or contaminated regions. In this method, we separately approximate NDVI using spatial and temporal components of the time-varying satellite data. Spatial approximation near the boundary of the missing data is expected to be more accurate, while temporal approximation becomes more reliable for regions further from the boundary. Therefore, we propose a model that leverages the distance transform to combine these two methods into a single, weighted model, which is more accurate than either method alone. We introduce a new decay function to control this transition. We evaluate our spatiotemporal model for approximating NDVI across 16 farm fields in Western Canada from 2018 to 2023. We empirically determined the best parameters for the decay function and distance-transform-based model. The results show a significant improvement compared to using only spatial or temporal approximations alone (up to a 263% improvement as measured by RMSE relative to the baseline). Furthermore, our model demonstrates a notable improvement compared to simple combination (up to 51% improvement as measured by RMSE) and Spatiotemporal Kriging (up to 28% improvement as measured by RMSE). Finally, we apply our spatiotemporal model in a case study related to improving the specification of the peak green day for numerous fields.
Amirhossein Mirtabatabaeipour
Alumni M.Sc. Student
September 2019 - January 2026
Amirhossein is an MSc student interested in Digital Earth and Machine Learning.