GIV COVID-19 Visualization
Beta Version
With my research team, we have developed a digital platform for COVID-19 visualization: Click here or on the following figures.
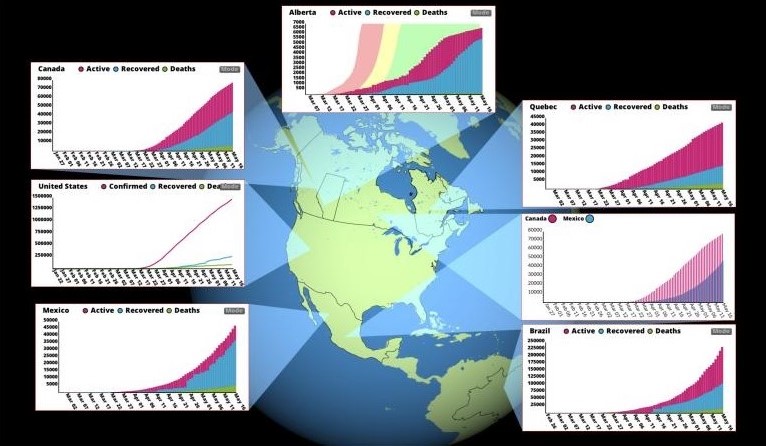
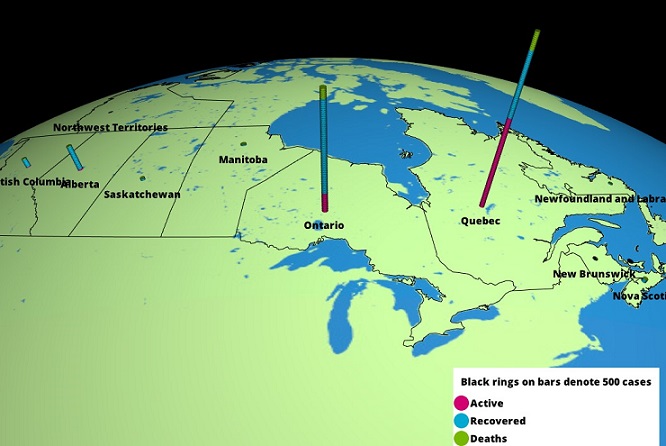
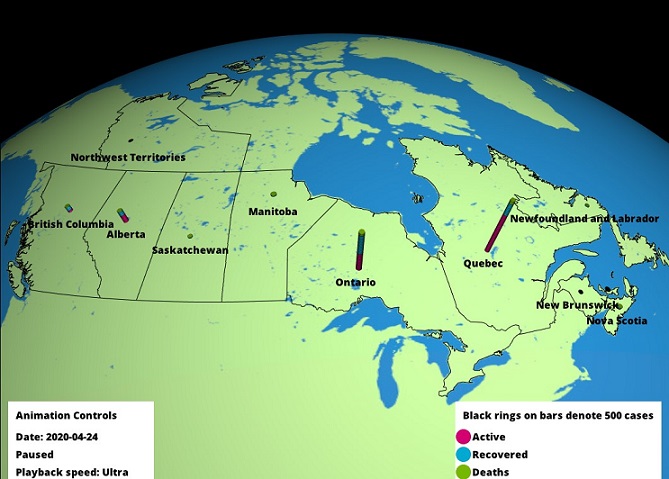
This is a globe-based multi-view visualization. In each view, multiple regional datasets can be compared. Currently, it supports daily updates for all countries and Canadian Provinces. For Alberta, we have more refined regional data. Finally, we are in the process of including 3d bars for representing regional COVID data. This web-based platform is based on our recent Digital Earth System created from DT DGGS: https://www.mdpi.com/2220-9964/9/5/315
Faramarz F. Samavati
Professor
My research interests include Computer Graphics, Geometric Modeling, Visualization, and Digital Earth.