Geometric Modeling
Introduction
Geometric modeling in computer graphics involves the mathematical representation of an object's shape and structure. It forms the foundation for creating 3D models, which are used in various applications such as animation, simulation, and virtual environments. Techniques like polygonal meshes, NURBS, and splines are commonly employed to define the geometry of both simple and complex objects in a digital space. Some of sub-projetcs in this area are:
-Naturasketch
-Flexible Projection
-Sankey Viz
-SBIM For Parametric Surfaces
Naturasketch
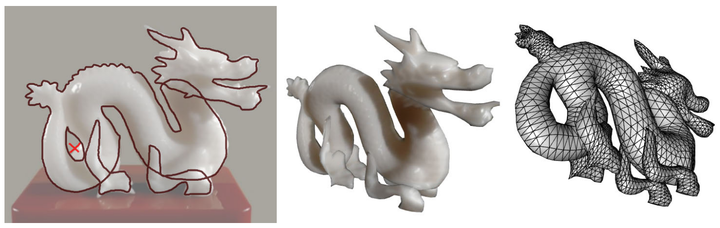
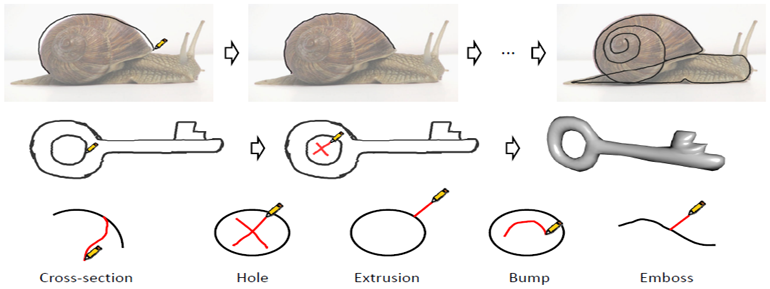
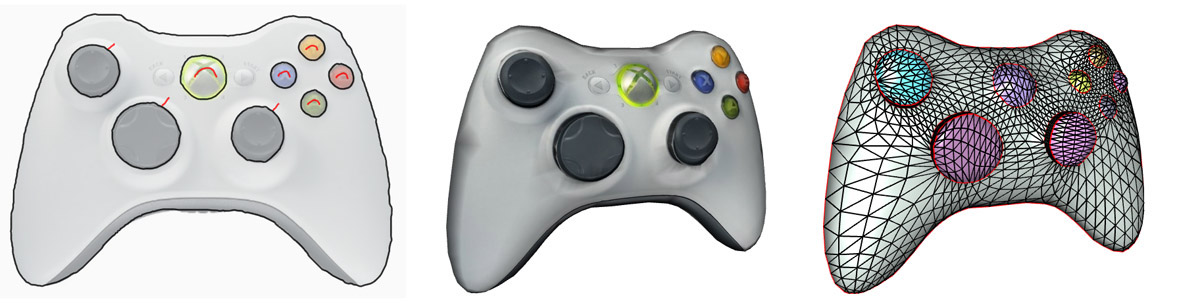
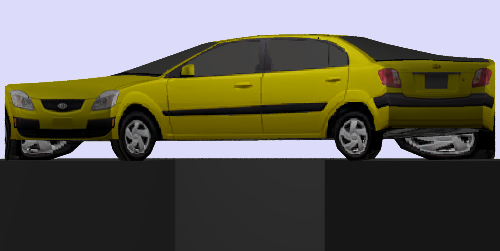
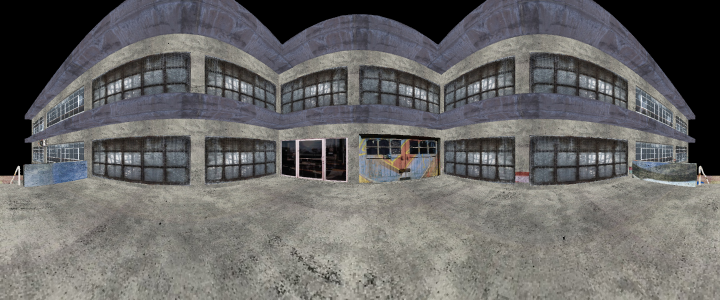
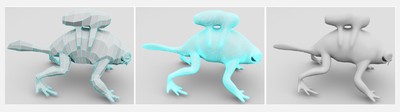
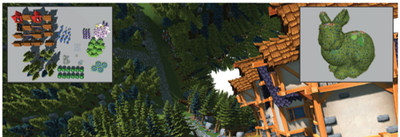
Naturasketch is an image assisted sketch-based modeling system. The user can start with an image of the model and provide important strokes of the object by simply drawing on the image. Then system creates a 3D model using the given strokes. In addition, the appropriate portions of the image are used as the texture for the model. Some modeling actions (e.g. make a hole, or add on-demand details) are supported through annotated strokes using a red pen.
The underlying 3D models are feature-sensitive subdivision surfaces with controllable details. Creating detailed digital content is a major task in industries such as Game, Film and CAD, and requires well-constructed, high quality geometric models. However, even with sophisticated software packages, geometric modeling is still a challenging, tedious and time consuming task. Using this modeling tool complex models can be created in a matter of minutes rather than hours.
A demo of the early version of this system:
Achievements
- Digital Alberta Awards 2013, Best in Cross-Platform, GRSktech (commercial version of Naturasketch), June 2013.
- Received IEEE Computer Graphics and Applications 2011 Best Paper Award (see the related papers).
Flexible Projection
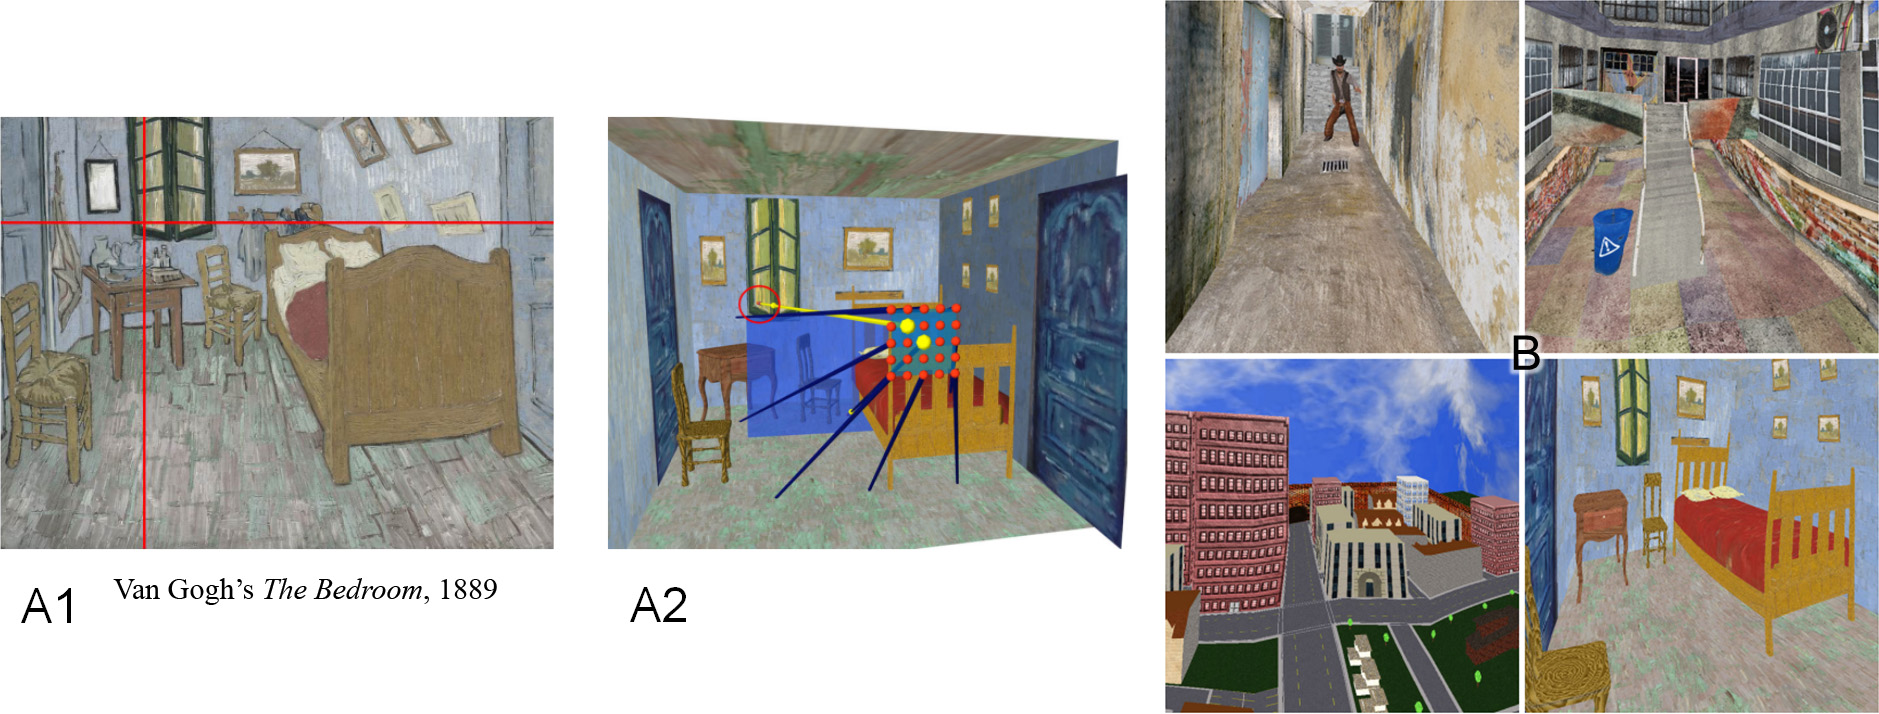
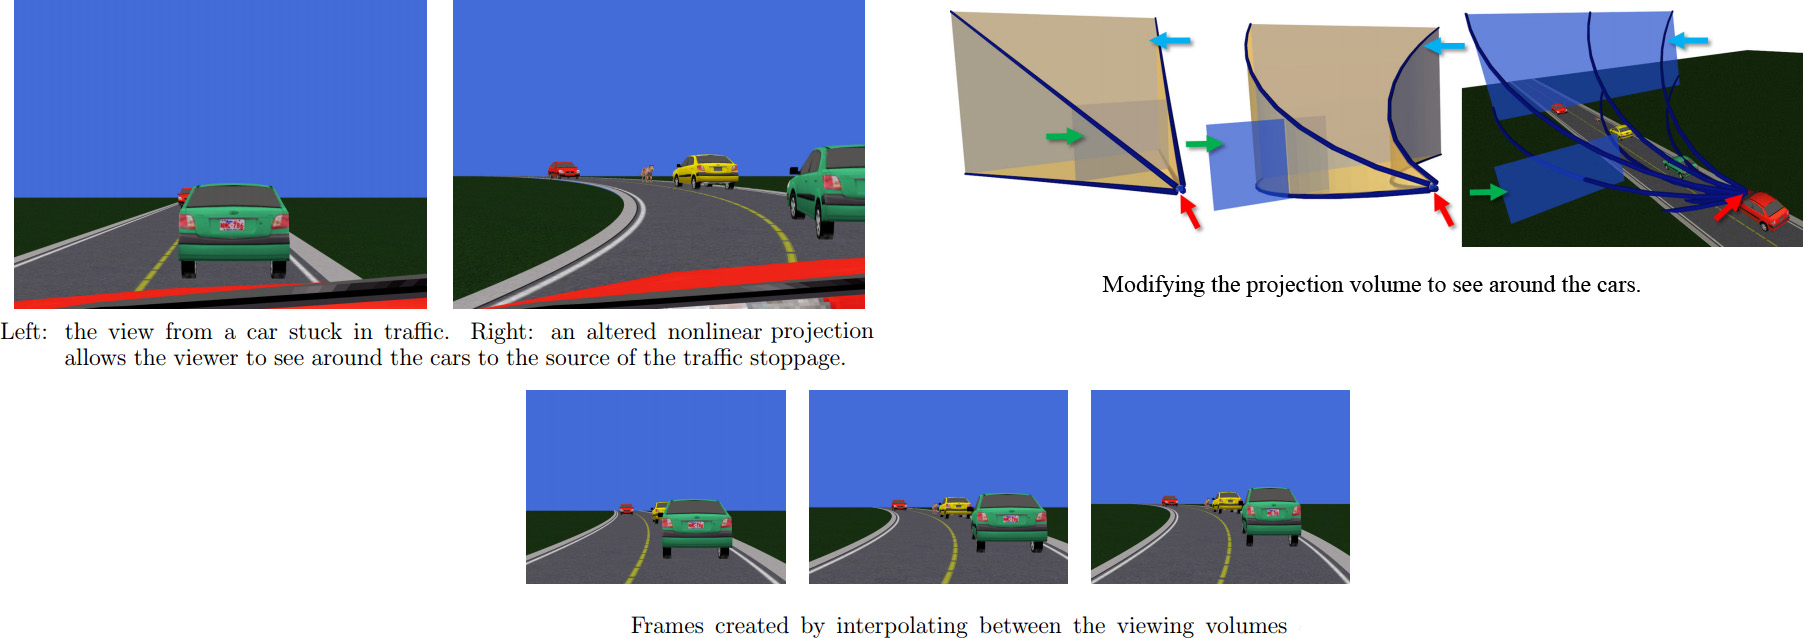
When you take a picture you are performing a projection from three dimensions (the world) down to two dimensions (a flat photograph). While camera perform one type of projection, different lenses (e.g., fisheye lenses) and photographic methods (panorama stitching) create different types of projections.
However, there are a wide variety of other projections that cannot be taken with a camera. For instance, the orthographic projections used to create blue prints. In paintings artists take this even further exploring entirely different representations of space.
Flexible projection is a project that aims make a wider variety of projection possible within computer graphics environments. One of the main concepts in this work is to employ modeling techniques and interfaces to organize the flattening of a volume into a 2D plane. Flexible Projection not only provides a means for including nonstandard projections in graphics systems but also provides a consistent means of creating and working with a wide variety of different projections.
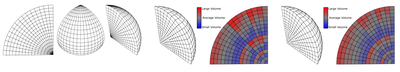
Flexible Projection explicitly model the 3D volume as a parametric volume. Beginning with a cube one can flexibly adjust this volume into other shapes: a frustum for perspective, a cylinder for a cylindrical panorama, a hemisphere for a fisheye thus allowing for a diverse variety of projections. This relation between the volume's shape and the resulting projection creates a link that can assist in visual communication of the projection's behaviour without resorting to mathematical equations.
We have explored several different applications for Flexible Projections:
Sankey Viz
Energy systems encompass the generation and conversion technologies as well as the distribution network which provide energy services (mobility, comfort, light, nutrition, industrial products, etc) from the energy sources that nature provides. Examples of energy sources include the fossil fuels(coal, oil and gas), uranium and renewables (hydropower,biomass, wind, solar). These energy sources are converted into commodities or currencies (e.g., gasoline, diesel, electricity, wood pellets, etc) that can be moved to where the energy is needed to be converted into a service. Some of the elements that form energy systems are the energy flow inside a region, production levels for energy sources, trade of energy across regions and also other attributes such as amount of green house gas (GHG) emissions produced through out the process of energy generation to delivery. Following image represents Canada's Sankey diagram in 1978.
Sankey diagrams are a common means used to show the magnitude of energy flows from resources, through commodities to services. These diagrams provide a top-down perspective on energy systems and make it possible to identify major features, inconsistencies or questionable aspects of the data that require closer and critical analysis. A Sankey diagram arranges nodes in layers based on the incoming and outgoing edges. In energy systems, resources are usually placed on the leftmost layer and services are on the rightmost layer. In typical Sankey diagrams, edges are represented by a smooth curve where the thickness represents flow quantity. Following image shows a Sankey diagram in two different levels of detail.
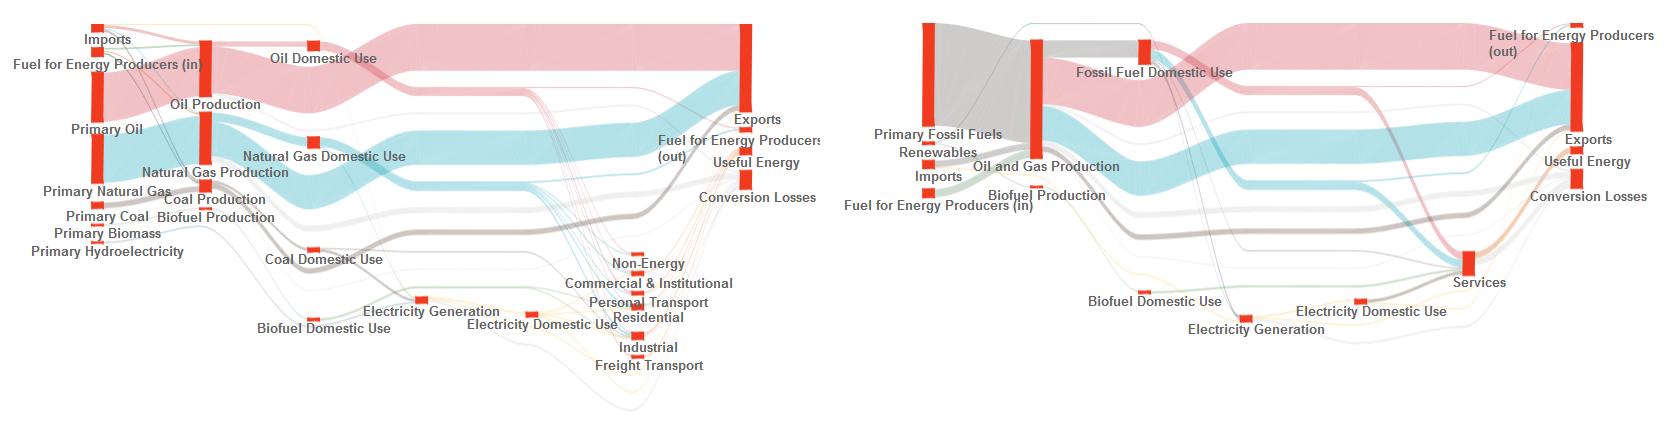
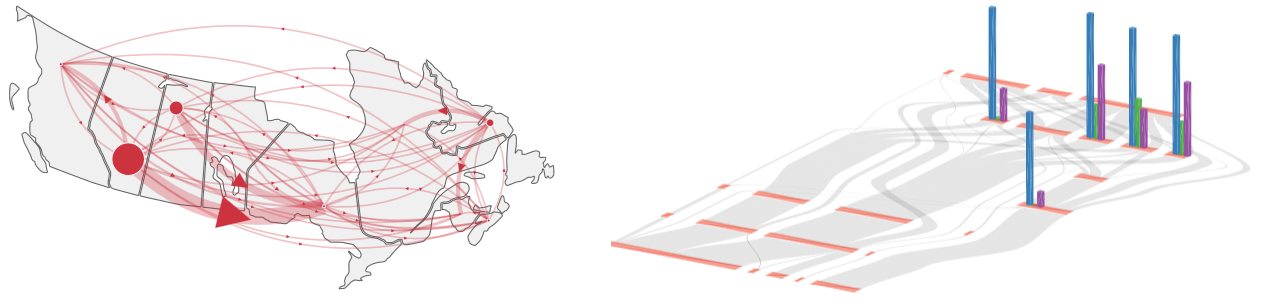
In this project we build a visualization tool that provides an interface for exploring time-varying, multi-attribute and spatial properties of a particular energy system. The tool integrates several visualization techniques to facilitate exploration of the energy system. These techniques include Sankey diagram representation to show energy flow, 3D interaction with Sankey diagrams for expanding viewable data attributes such as emissions and an interactive map integrated with flow diagrams for simultaneous exploration of spatial and abstract information. We also perform level of detail exploration on flow diagrams and use smooth animation across the visualizations to represent time-varying data. In the following image, (left) is a flow map and (right) is the emissions shown on a Sankey diagram.
Watch a demo of our visualization tool:
SBIM For Parametric Surfaces
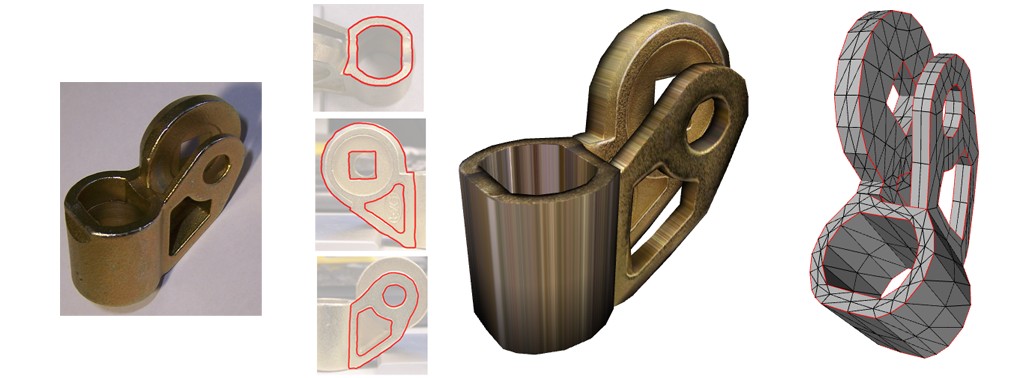
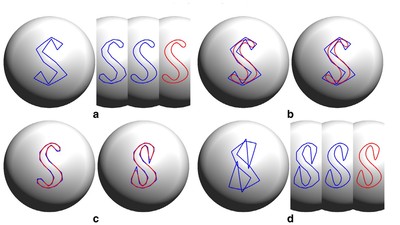
In this Sketch-based modeling project, free-form parametric surfaces are created using just a few strokes. The technique is inspired by the traditional illustration strategy for depicting 3D forms where the basic geometric forms of the subjects are identified, sketched and progressively refined using few key strokes. We introduce two parametric surfaces, rotational and cross sectional blending, that are inspired by this illustration technique. We also describe orthogonal deformation and cross sectional oversketching as editing tools to complement our modeling techniques.
A demo of the early version of this system:
Faramarz F. Samavati
Professor
My research interests include Computer Graphics, Geometric Modeling, Visualization, and Digital Earth.
Publications
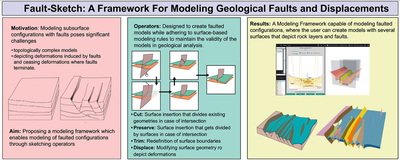
Fault-sketch: A framework for modeling geological faults and displacements (2024)
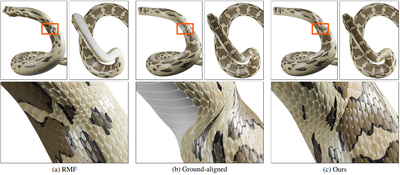
Balancing Rotation Minimizing Frames with Additional Objectives (2023)
RIAS: Repeated Invertible Averaging for Surface Multiresolution of Arbitrary Degree (2020)
Toward volume preserving spheroid degenerated-octree grid (2020)
LifeBrush: Painting, simulating, and visualizing dense biomolecular environments (2019)
Multiscale NURBS curves on the sphere and ellipsoid (2019)
Interactive example-palettes for discrete element texture synthesis (2019)
Offsetting spherical curves in vector and raster form (2018)